Rᶦₚ₀,₂ / Yield strength
Dashboard
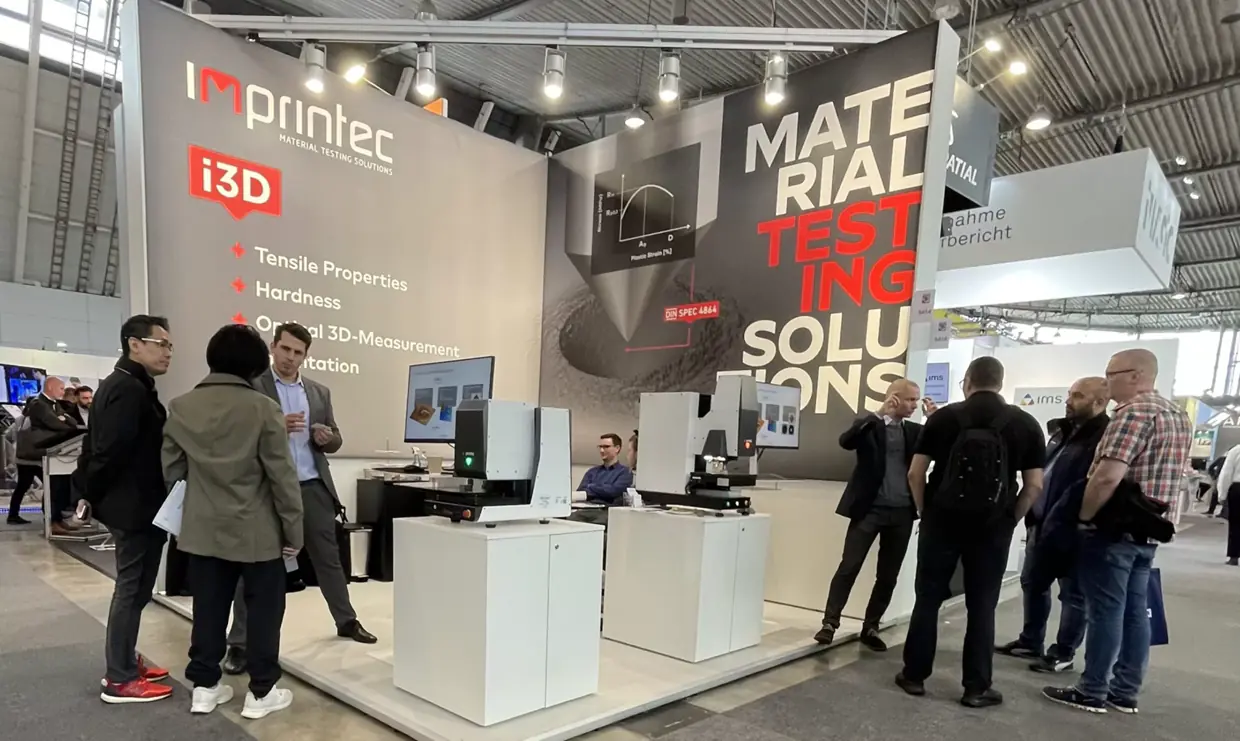
Correlation - tensile testing vs. i3D® (Indentation Plastometry)
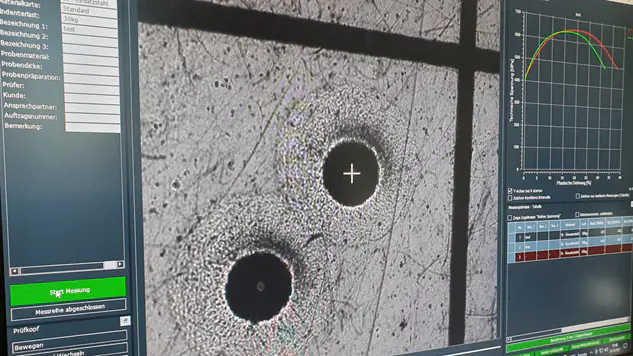
The dashboard mirrors the live data logic of the current Imprintec site: filter the selection, inspect scatter plots, review key statistics and compare local i3D® results against tensile references in one place.
Scatter plots & correlation
Rᶦₘ / Tensile strength
Statistics (current selection)
Data
| Metal | Material class | Alloy group / treatment | Alloy | Load [kgf] | Indenter geometry | YS i3D® [MPa] | YS tensile [MPa] | YS comp. [%] | UTS i3D® [MPa] | UTS tensile [MPa] | UTS comp. [%] |
|---|
No records match the current filter.
The current view uses a curated demo dataset across typical metal classes to represent the dashboard logic, filtering and comparison flow.
Why the dashboard matters
The dashboard shows i3D® as an evaluation workflow rather than only as a device view. Users can compare local i3D® values with tensile references, inspect scatter behaviour and narrow the selection by material logic.
- filter by metal, alloy family, indenter and test load
- compare yield strength and tensile strength side by side
- use statistics and table view for development, QA and data review
Knowledge pages should help users move through related trust and orientation topics.