Local stress-strain curves for FEM
Instead of applying one global material model to the entire component, zone-specific stress-strain curves can be integrated directly into the simulation.
Application
FEM and Simulation
i3D® for FEM and process simulation with local stress-strain curves, yield strength Rᶦₚ₀,₂ and tensile strength Rᶦₘ directly from real component zones.
Instead of applying one global material model to the entire component, zone-specific stress-strain curves can be integrated directly into the simulation.
Changes in wall thickness, thermally affected areas, forming zones and microstructural gradients can be represented more realistically from a materials perspective.
Local yield strength Rᶦₚ₀,₂, tensile strength Rᶦₘ and plastic stress-strain curves become technically usable for material cards, FEM and process models.
More realistic input data increases the reliability of stress distributions, limit states, failure risks and design decisions.
In many FEM models, a single stress-strain curve, usually from a tensile test, is applied to the entire component.
That approach becomes inaccurate as soon as real material differences caused by wall thickness, thermal influence, degree of forming, weld zone or microstructural progression start to matter.
With i3D®, locally resolved plastic stress-strain curves can be determined directly on the component through the combination of 3D indent measurement and FEM-based inverse calculation.
These local stress-strain curves, together with Rᶦₚ₀,₂ and Rᶦₘ, can be used point by point as input data for FEM and process simulation.
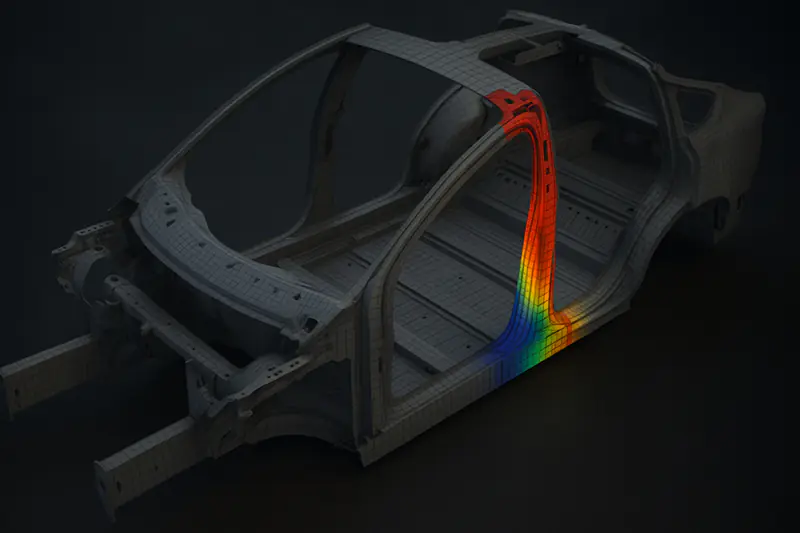
The difference becomes visible directly on the connecting rod: one global model with one uniform stress-strain curve is compared with an i3D® model using locally measured stress-strain curves from three zones.
The result is a more differentiated stress distribution with lower values in zone C, medium values in B and higher values in A, which is closer to the real local loading situation.
Especially in weld seams and heat-affected zones, local mechanical properties determine component behaviour, crack risk and transition loading.
With i3D®, local material values from the weld and HAZ can flow directly into the simulation instead of describing these zones only through global approximations.
Contacts
For CAE and process simulation, zone, load case and modelling target should be clear early so that local stress-strain curves, Rᶦₚ₀,₂ and Rᶦₘ can be transferred cleanly.